Synthetic control method in the wild
 |
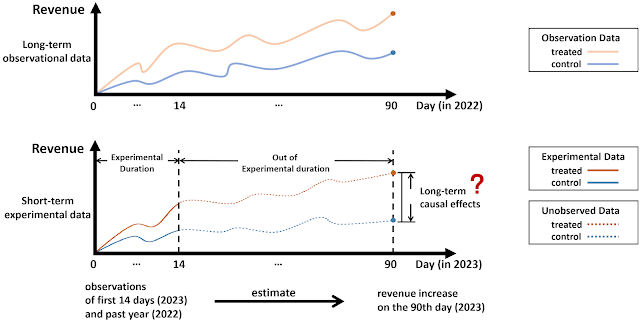
| Image courtesy of dataingovernment.blog.gov.uk |
Podcast-style summary by NotebookLM
Academic's take
Synthetic data is increasingly popular across the board. From deep learning to econometrics, artificially generated data is used for a number of purposes. In deep learning, one such use case is to train neural network models using artificially generated data. In econometrics, synthetic data has recently found another use case: creating control groups in observational studies for causal inference.
Synthetic data + control groups: Synthetic controls. This is too generic of a name for a specific method. In this post, I will focus on the synthetic control approach developed by Abadie et al. (2010, 2014) and previously Abadie & Gardeazabal (2003). Athey and Imbens (2017) describe Abadie et al.'s work as "arguably the most important innovation in the policy evaluation literature in the last 15 years."
Why is it needed?
Measuring the causal effect of a treatment requires a counterfactual (what would've happened if the treatment did not occur) to compare with what is observed following the treatment (what really happened). The causal effect is the difference between the two (what really happened with the treatment minus what would've happened w/o the treatment). For example, a price promotion is applied to a product and the resulting demand is observed. Let's say the demand increased from 100 to 110 units. What would have been the demand if the promotion was not applied? We will never know this unless we can observe two parallel universes. In the absence of a direct observation of two such outcomes, let's say we use another product free of the promotion to serve as the counterfactual. To find a truer causal effect, these two products must not differ in any other way with respect to the demand except for the promotion. This is difficult to establish (factors other than the promotion can easily affect the demand).
What is it?
Formally developed in early 2000s and articulated further in Abadie et al. (2010, 2014) and Abadie (2021), synthetic controls offer a way to generate an artificial control unit using multiple actual control units. This artificial, or synthetic, control is shown to serve well as a counterfactual even if none of the actual control units involved in the synthesis alone serves as a counterfactual for the treated unit.
How is it done?
Three steps to synthesize the control:
- Choose predictor variables that explain the outcome in the pre-treatment period (that are observed for both untreated units and the treated unit). Include some lagged values of the outcome variable in the predictor set. These variables will be time-invariant (Calculate and use means if the predictors are time series).
- Identify possible untreated units to synthesize into a control to serve as a counterfactual.
- Use an objective function to find a weight for each untreated unit and a weight for each predictor. Let $\textbf{X}_1$ be a $(R+T_0)\times 1$ vector of pre-treatment characteristics for the treated unit. Similarly, $\textbf{X}_0$ is a $(R+T_0) \times J$ matrix of the same variables for the untreated units. Abadie et al. (2010) minimizes the following distance measure:
- $$||\textbf{X}_1-\textbf{X}_0\textbf{W}||_{\textbf{V}} = \sqrt{(\textbf{X}_1-\textbf{X}_0\textbf{W})'\textbf{V}(\textbf{X}_1-\textbf{X}_0\textbf{W})} \qquad\qquad$$
- The calculation produces two outputs: matrix $\textbf{V}$, which forms the the weights on the predictor variables (so they are included in the minimization differently depending on how well they predict the pre-treatment outcome), and an array of weights $\textbf{W}$ for the control units.
- Evaluate the pre-treatment period goodness of fit. This is an evaluation of how closely the synthesized control follows the treated unit before the treatment. A time series plot is a good start.
- Conduct placebo tests. The method can be repeated for every unit in the pool exactly as it is done for the treated unit. This would generate placebo synthetic controls. Plot all the time series. Our expectation is the placebos don't behave similar to the treated unit (i.e., the post-treatment difference between the treated unit and its synthetic control differs from that in the placebos).
- Calculate a p-value using Fisher's exact test. Calculate a ratio of mean squared prediction errors post-treatment vs. pre-treatment. If the treatment effect is weak, the post- and pre-period would map onto one another, yielding a ratio close to 1. For the treated unit, this number must be large.
- Conduct sensitivity analyses.
Director's cut
In retail, one of the questions we continuously find ourselves answering is whether a specific intervention worked. The success is usually measured in one primary and multiple secondary KPIs. It can be a lift in units, sales dollars, sales margin, average basket size (or units per transaction a.k.a. UPT), average basket value (a.k.a. AOV), and/or new customer acquisition.
- We may not have the budget to implement the intervention in a sufficiently large sample size. For example, if the plan is to test a new store layout, the initial "proof of concept" budget will likely allow changing the layouts of a limited number of stores.
- The intervention may be implemented in only one market (or a small subset of all markets). To give an example, when testing a new promotion, to create a consistent marketing message and customer experience, we focus on one (or a few) market(s) specifically.
- The intervention will affect all markets, stores, customers, or product lines. A policy change, such as matching the prices of competitors, when announced, will be accessible to all customers. A subset of stores or customers can't be used as a control in this case.
What is a synthetic control?
Modeling advice
- If the intervention is at the market level, make sure the donors selected are not impacted by another market level intervention (such as a marketing test) or a disruption (such as a hurricane).
- If the intervention is at a product line level, make sure complementary or substitute SKUs are not selected as donors. The intervention could steal share from the substitutes or lift the sales of complements. Adding either one of them to the donor pool would result in biased estimates.
Implications for data centricity
Implementation
References
- Abadie, Alberto, and Javier Gardeazabal. 2003. “The Economic Costs of Conflict: A Case Study of the Basque Country.” American Economic Review 93(1): 113–32.
- Abadie, Alberto, Alexis Diamond, and Jens Hainmueller. 2010. “Synthetic Control Methods for Comparative Case Studies: Estimating the Effect of California’s Tobacco Control Program.” Journal of the American Statistical Association 105(490): 493–505.
- Abadie, Alberto, Alexis Diamond, and Jens Hainmueller. 2014. “Comparative Politics and the Synthetic Control Method.” American Journal of Political Science 59(2): 495–510.
- Abadie, A. (2021). Using synthetic controls: Feasibility, data requirements, and methodological aspects. Journal of Economic Literature, 59(2), 391-425.
- Athey, S., & Imbens, G. W. (2017). The state of applied econometrics: Causality and policy evaluation. Journal of Economic perspectives, 31(2), 3-32.